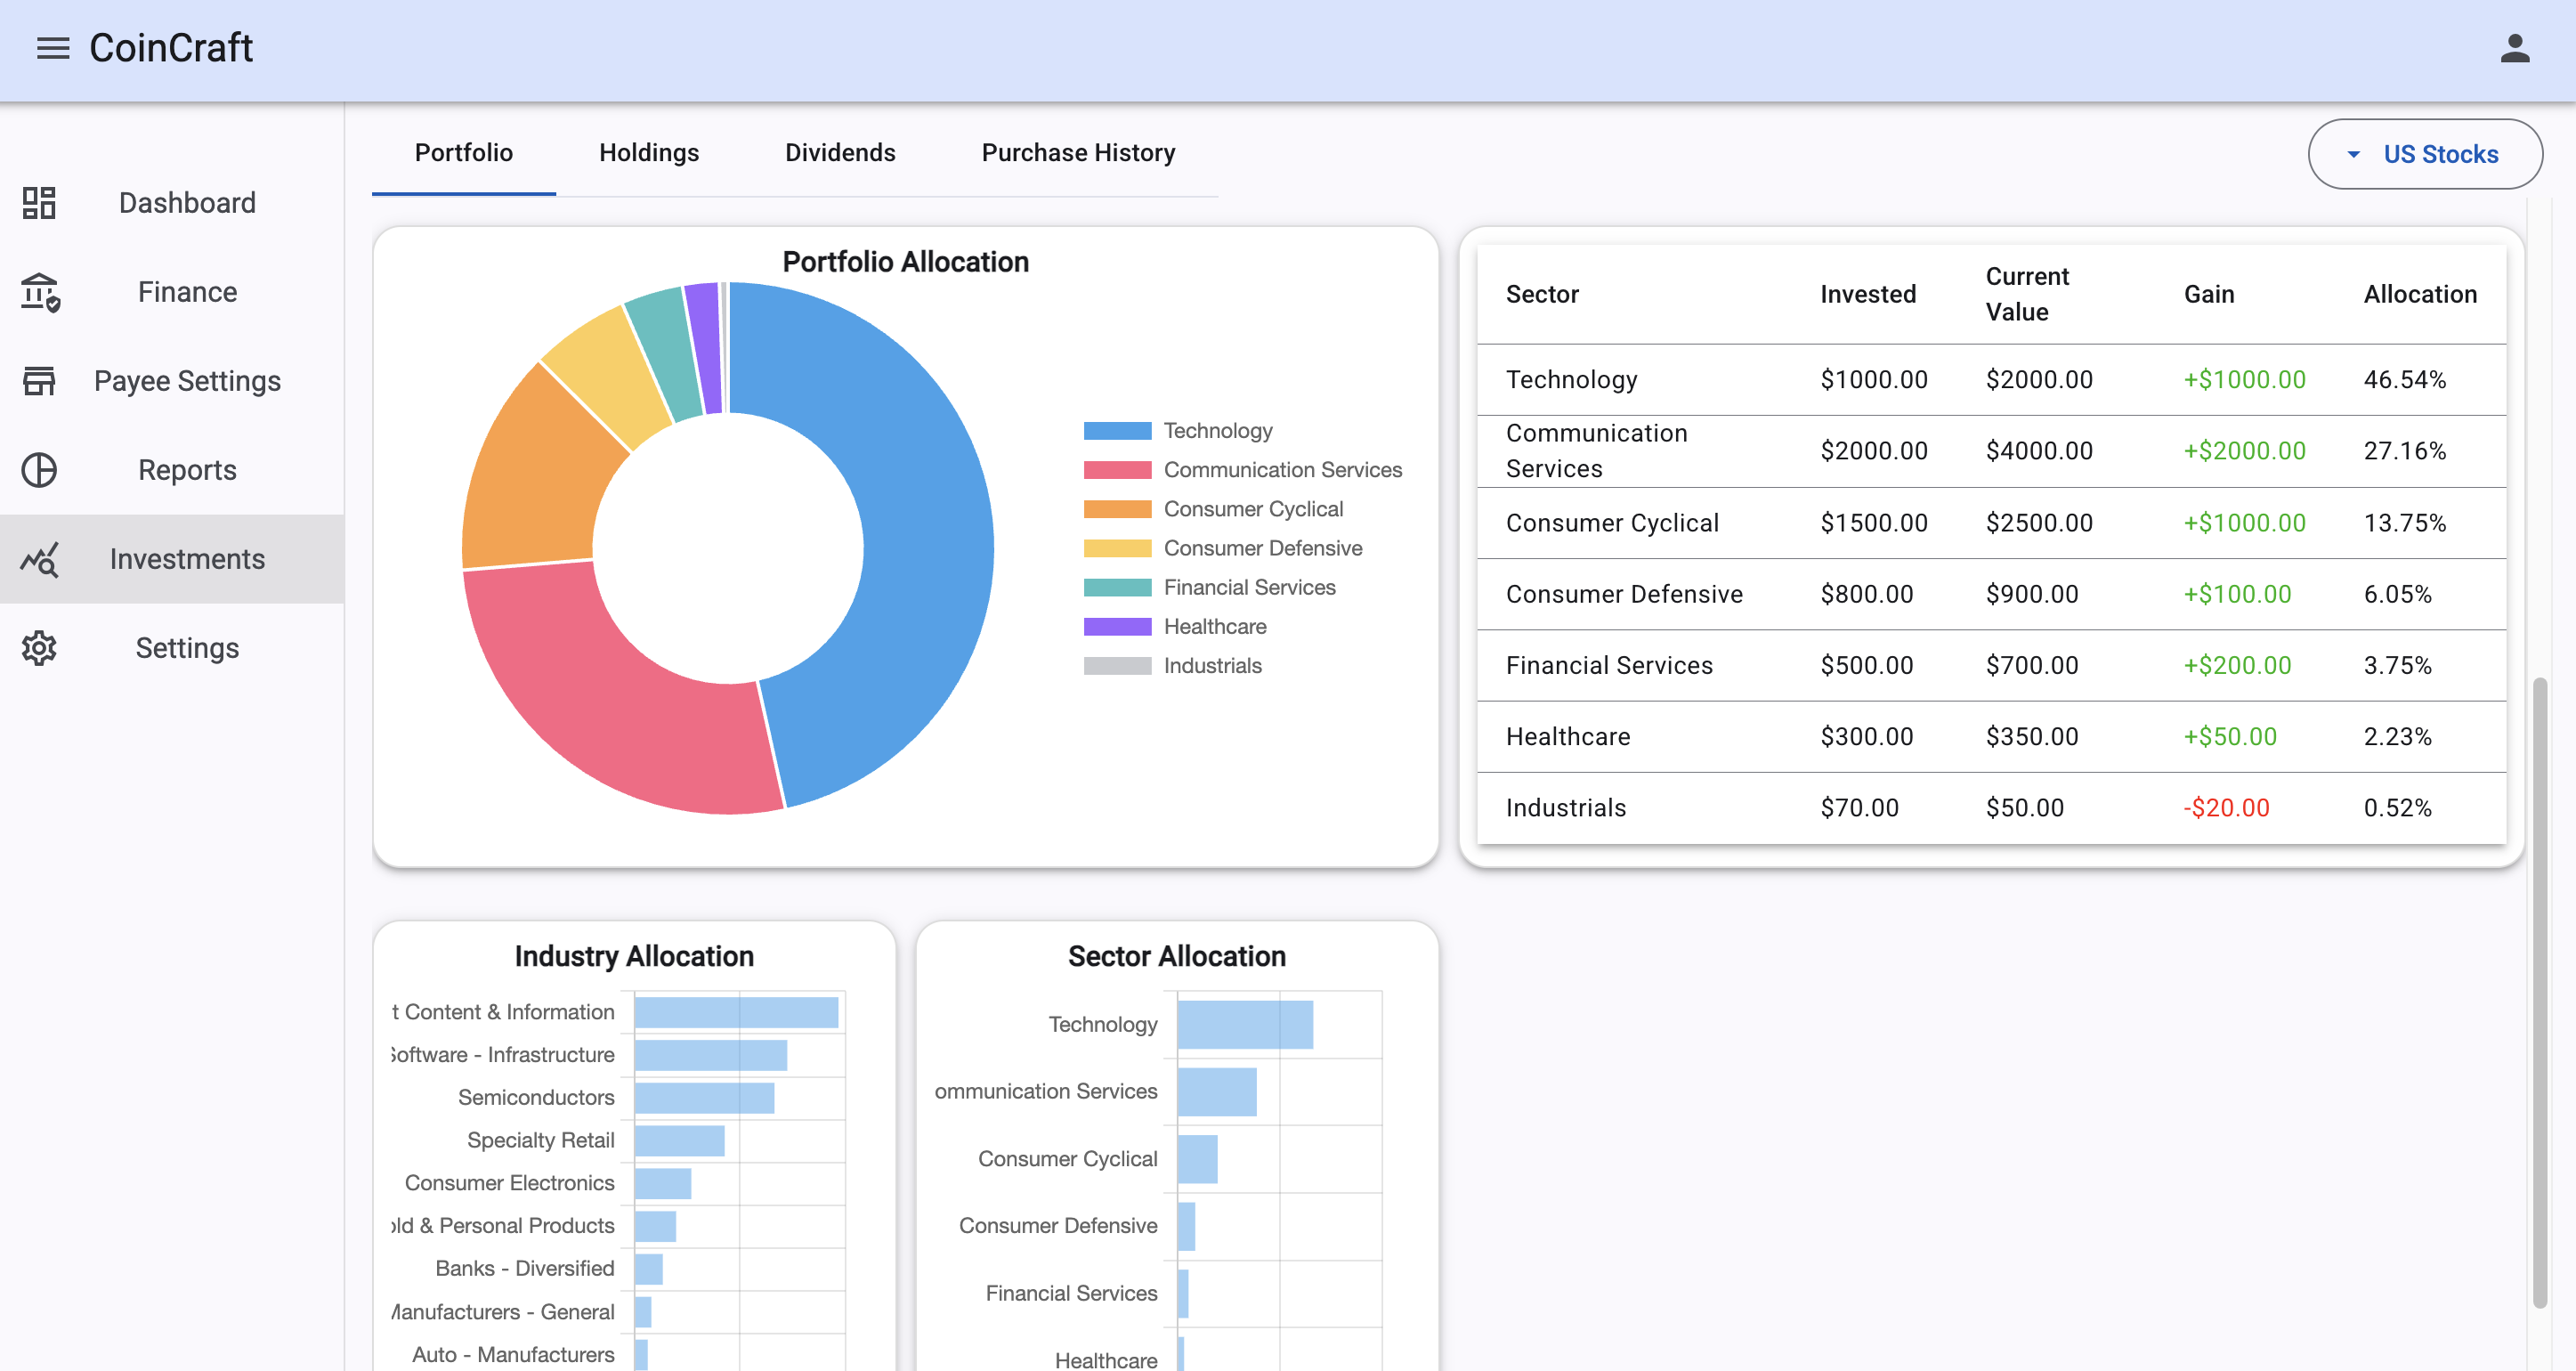
Detailed portfolio overview
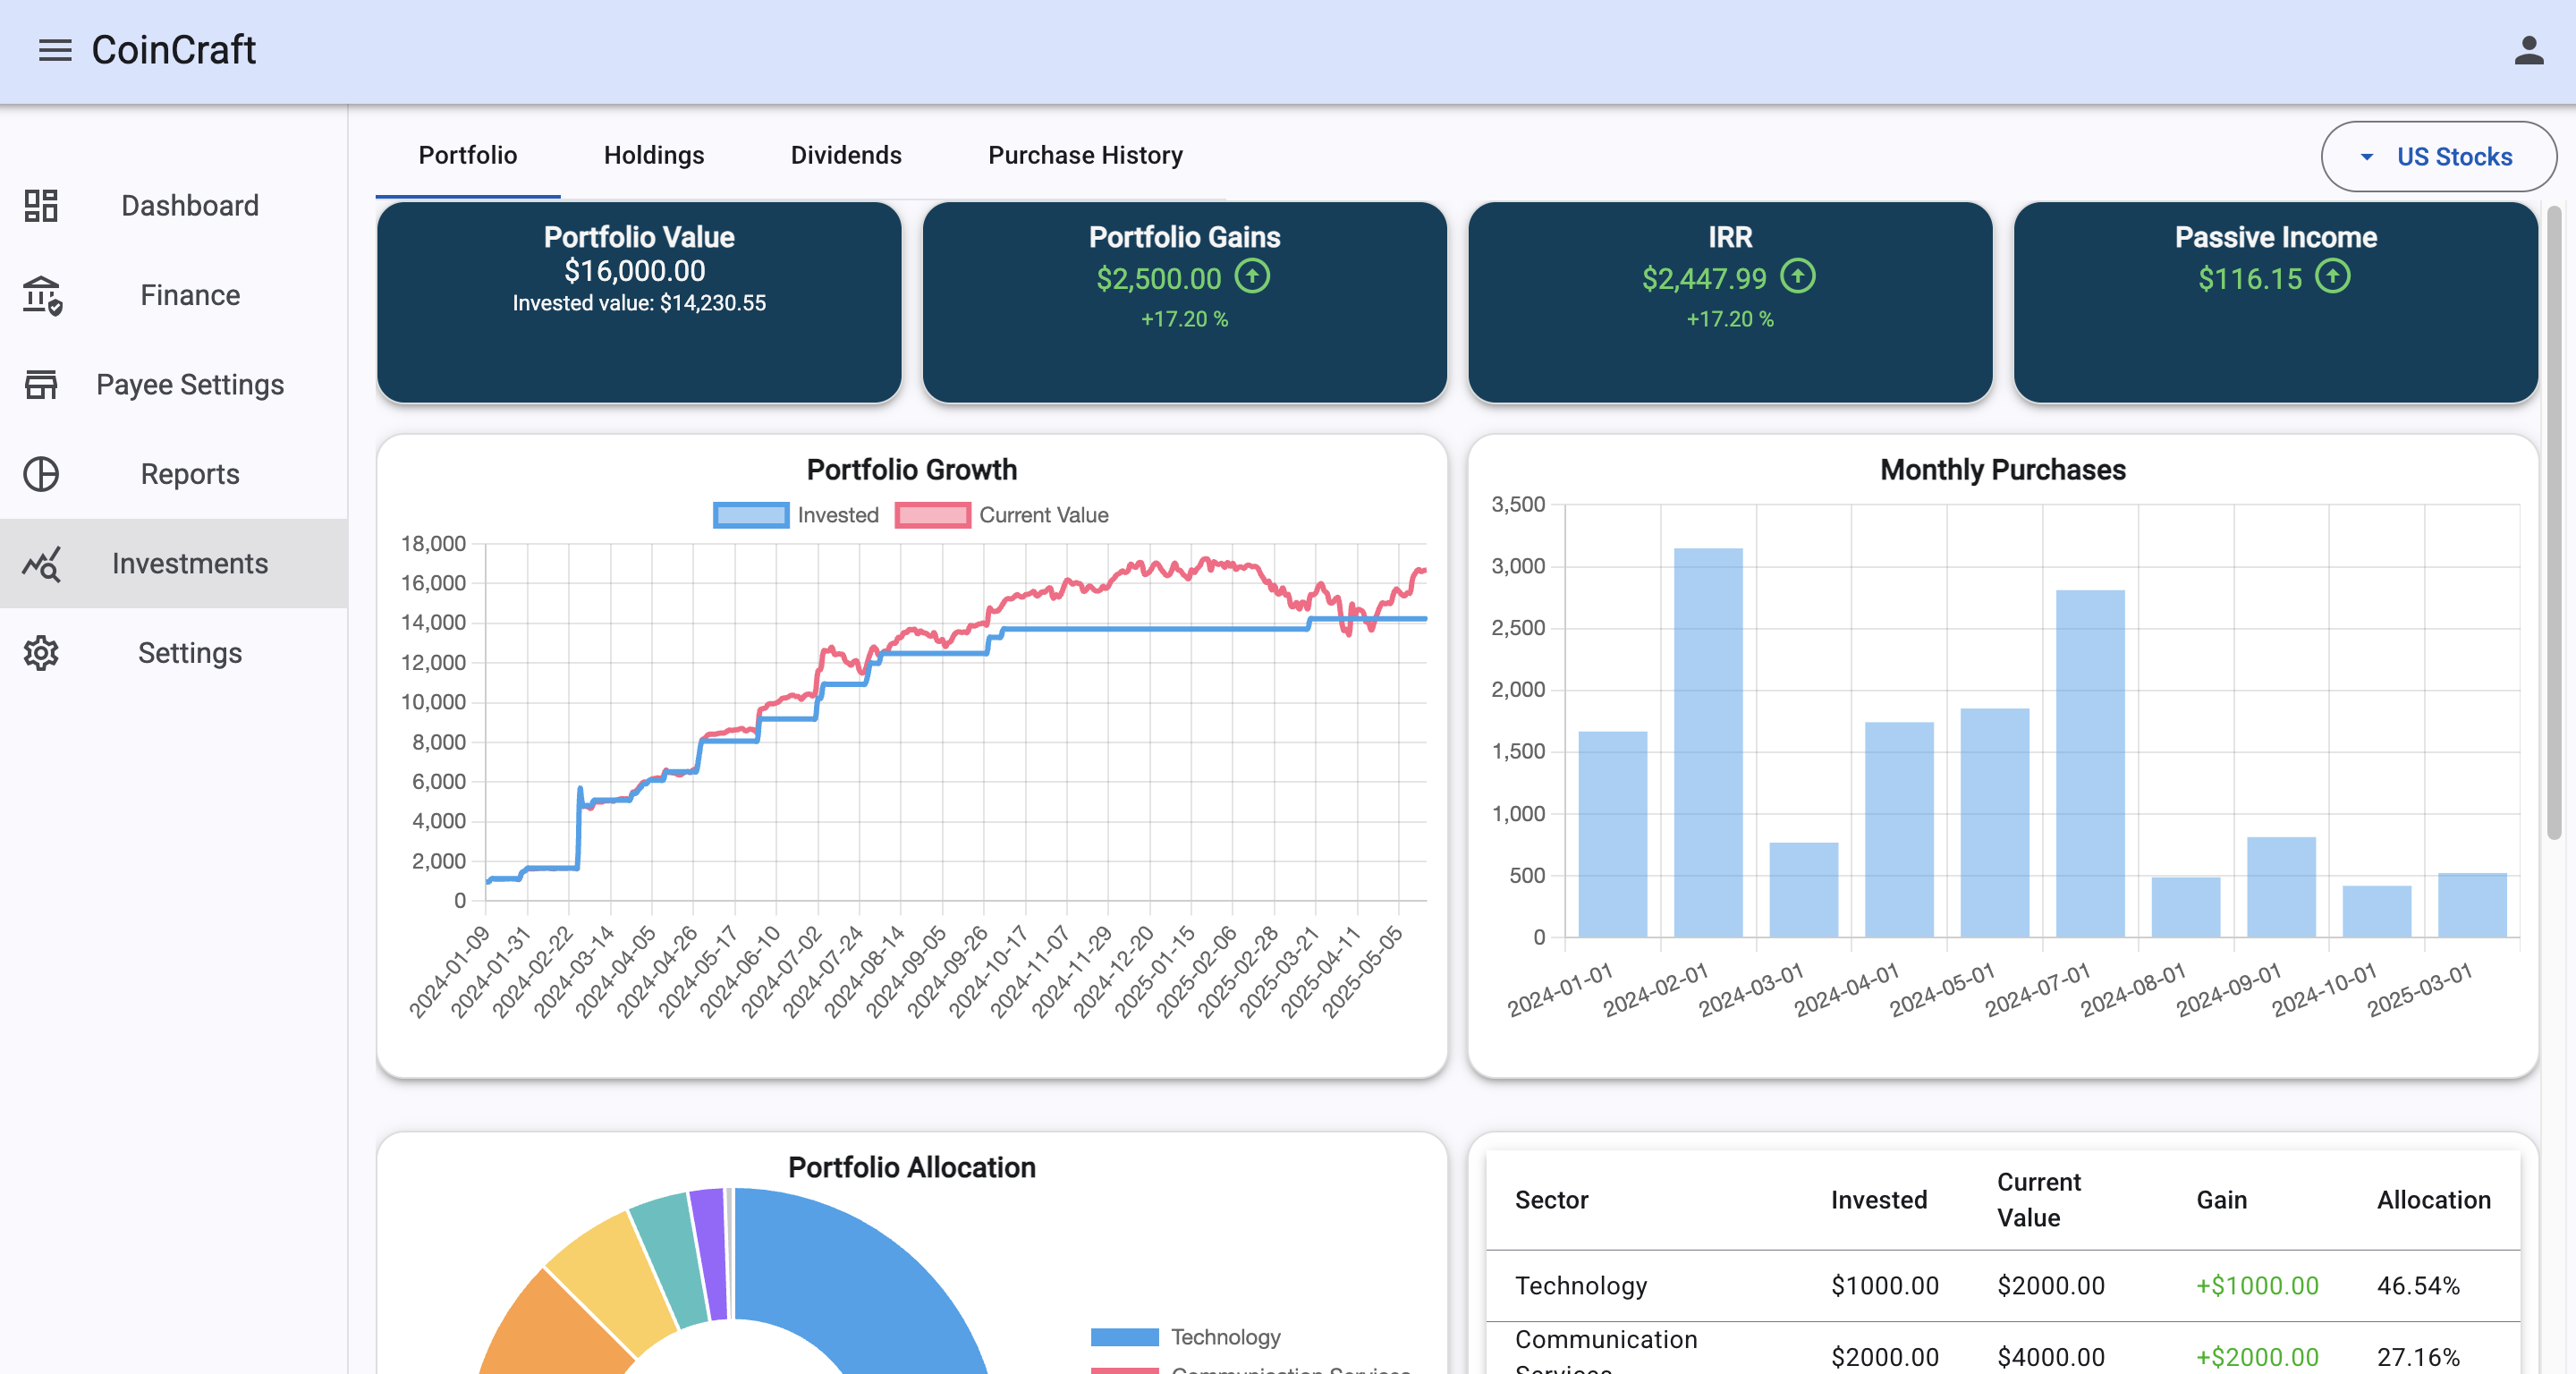
The dashboard gives an instant snapshot of holdings, market value, profit/loss, and diversification so investors can understand portfolio movement without digging through spreadsheets.
Personal project / Investment analytics platform
A portfolio management platform for tracking holdings, market value, gain/loss, dividends, transactions, and brokerage imports through a practical investment dashboard.
Product capabilities
The dashboard gives an instant snapshot of holdings, market value, profit/loss, and diversification so investors can understand portfolio movement without digging through spreadsheets.
View detailed performance for each stock, connecting holdings data with portfolio-level performance and analytics.
Track upcoming dividend dates, expected amounts, ex-dividend dates, payment dates, and historical dividend income.
Make dividend income easier to inspect by presenting payout history and future expectations alongside portfolio data.
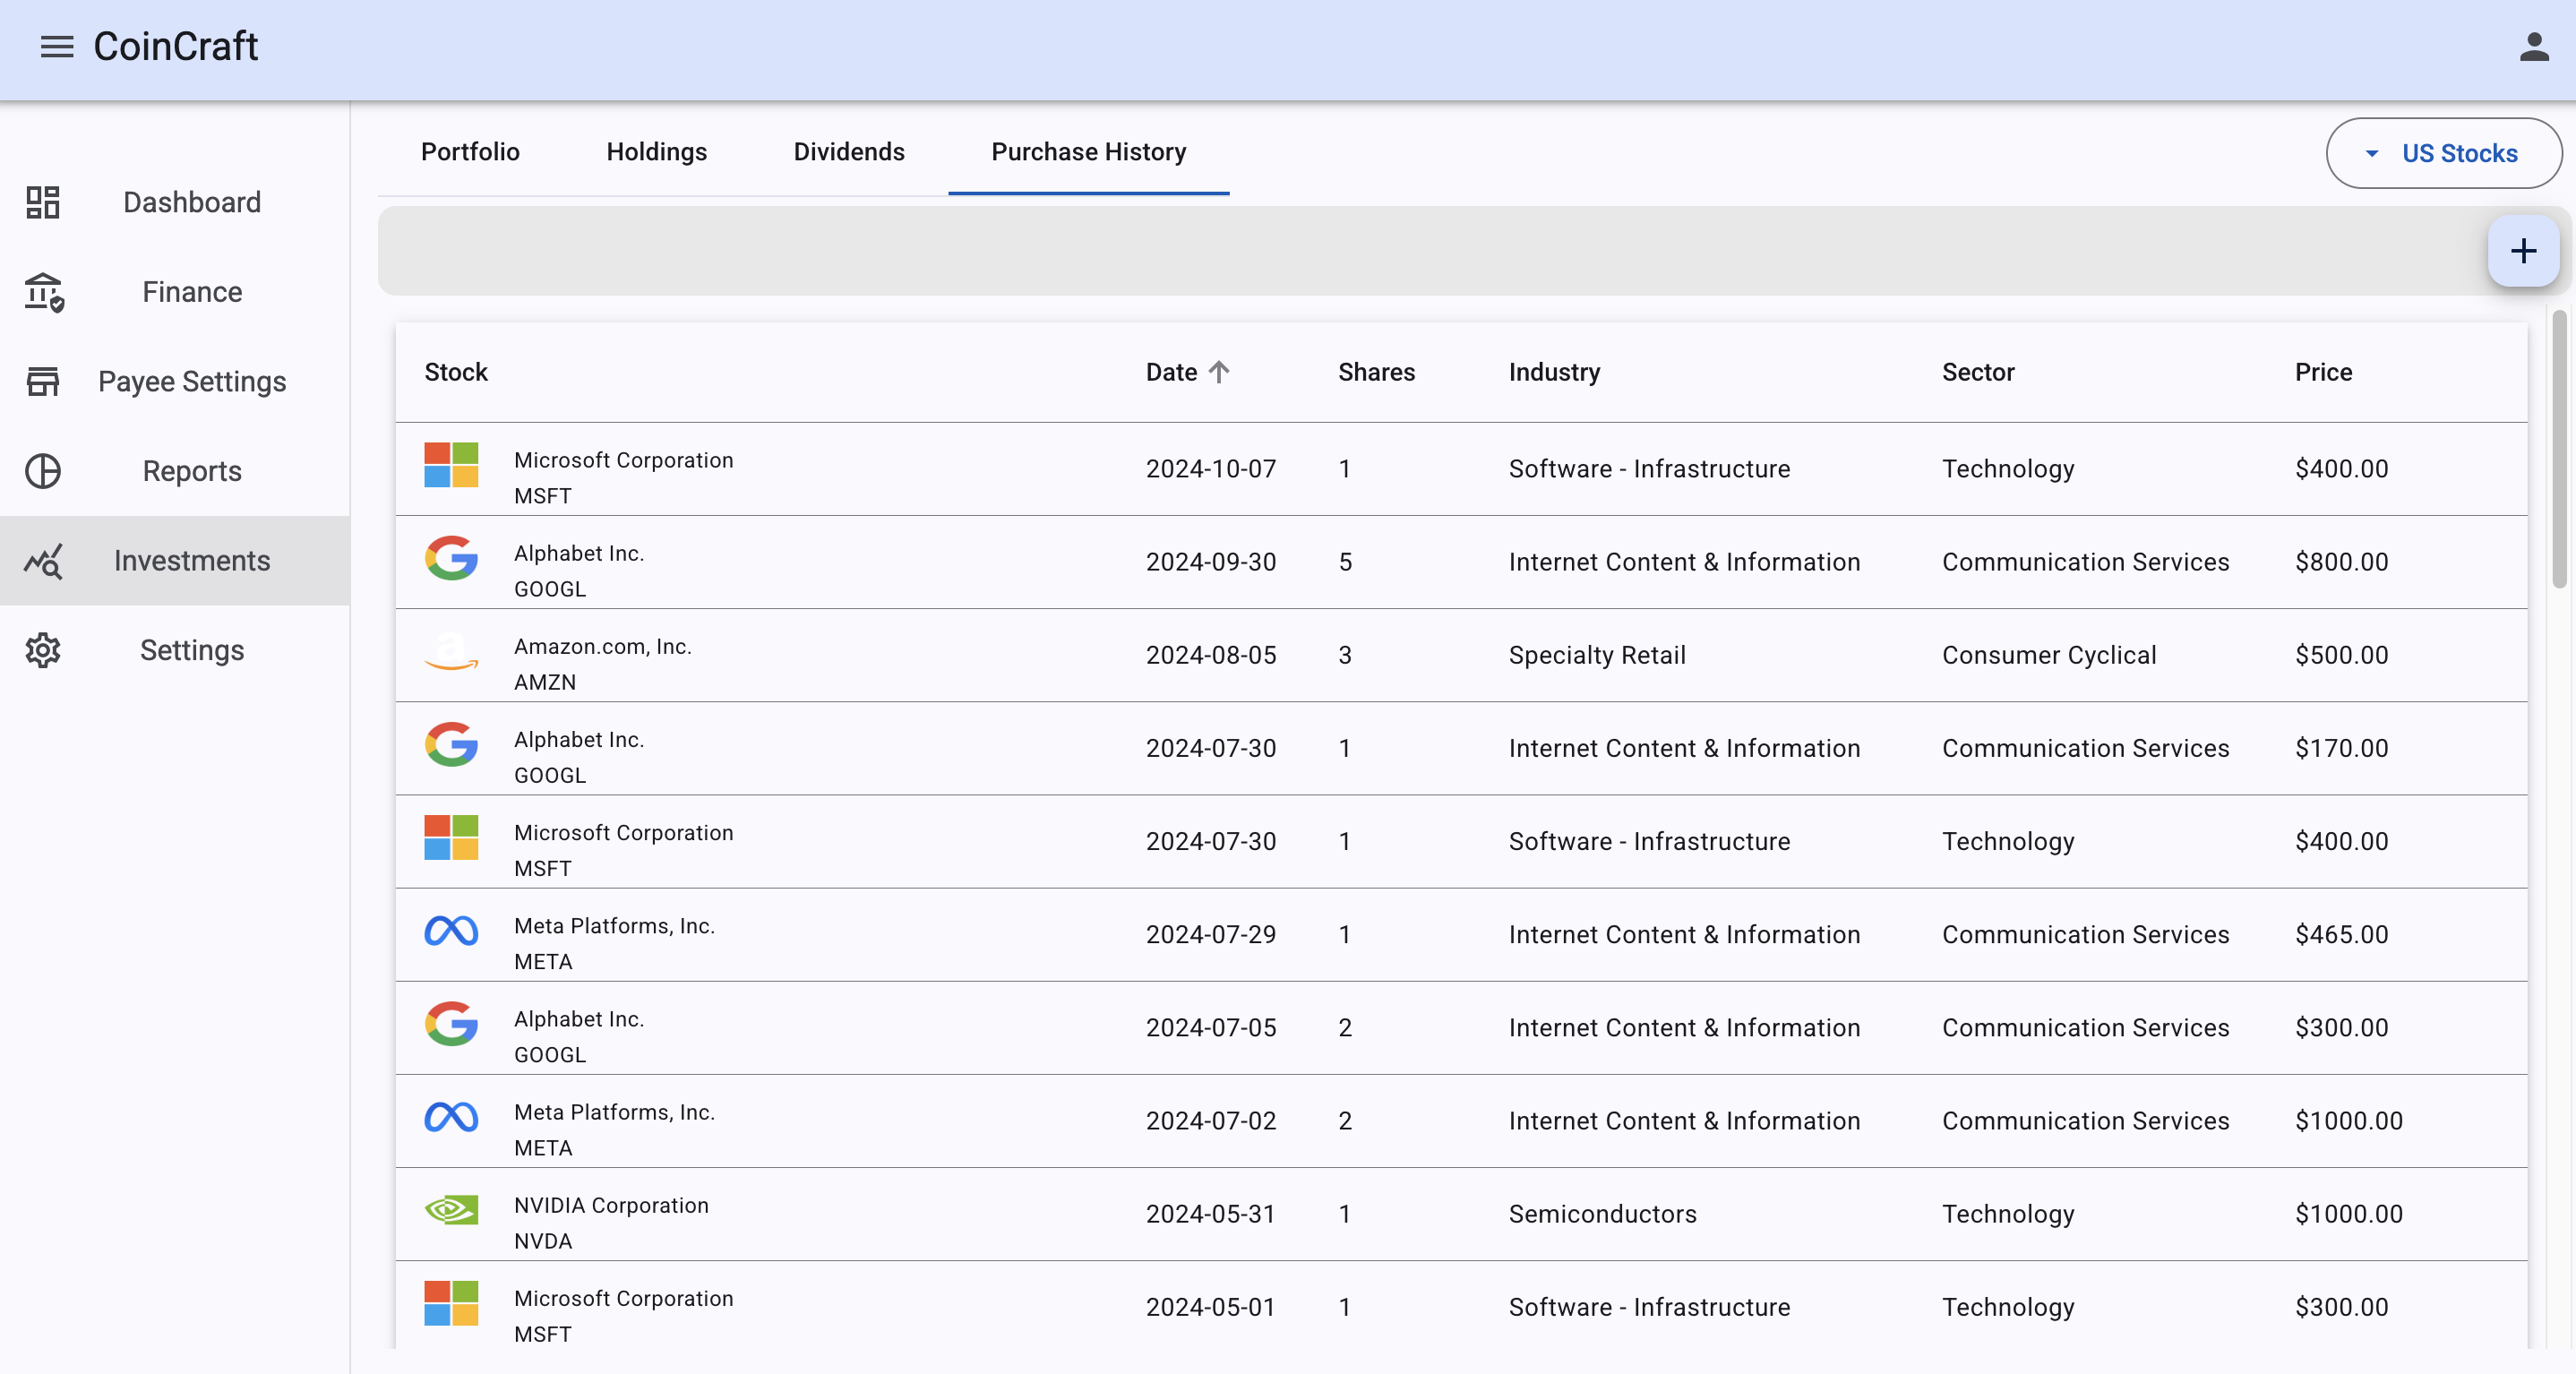
Record buy/sell transactions and dividend income, linking every trade to holding performance, cost basis, and gain calculations.

Upload CSV and QIF files to sync trades and balances, reducing manual entry and keeping investment data cleaner.

Demonstrates dashboard UX, financial calculations, backend data processing, database design, and cloud-ready product architecture.
Project takeaway
This project shows data-heavy product design, investment tracking, dividend reporting, import workflows, transaction modeling, and scalable full-stack engineering.